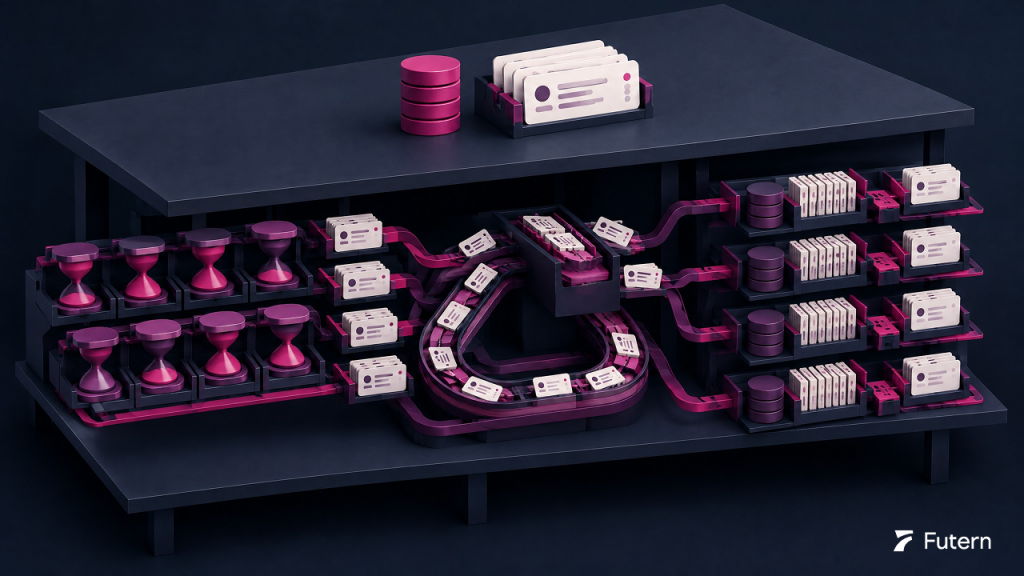
A three-layer cost analysis framework for calculating true B2B lead generation economics.
Search for "lead generation cost" and the answers come back quickly. B2B leads cost $40 to $200 each depending on industry and channel. Agency retainers run $3,000 to $15,000 per month. Pay-per-lead models charge $50 to $400 per qualified contact. These benchmarks are not wrong. They are incomplete.
The number most teams use when they talk about lead generation cost is the visible, budgeted expenditure divided by the number of leads it produced. This calculation captures the direct spend but misses two additional cost layers that often exceed the first. The hidden layer includes the human time, quality failures, and data maintenance that consume resources without appearing in the lead generation budget. The opportunity layer includes the revenue lost to speed gaps, coverage gaps, and capability misallocation that constrained processes create.
When all three layers are measured, the true cost of generating a qualified opportunity is typically two to three times higher than the benchmark CPL that appears on the team's reporting dashboard. This gap is where most lead generation economics go wrong, not because the spending is excessive but because the accounting is incomplete. Teams that understand only the first layer optimize for the wrong metric and make investment decisions based on a fraction of the real picture.
Why CPL Benchmarks Miss the Point
Industry benchmark reports publish average cost per lead figures with impressive precision. Technology sector: $130 per lead. Financial services: $270. Healthcare: $190. These numbers are useful as rough reference points, but they answer a question that is less important than it appears.
The question they answer is "how much does it cost to acquire a name and contact information for someone who has expressed some form of interest?" The question that matters for business decisions is "how much does it cost to produce a qualified opportunity that has a realistic chance of generating revenue?"
The gap between these two questions is where benchmark CPL stops being useful. A lead that costs $50 and converts to a qualified opportunity at a 2% rate produces opportunities at $2,500 each. A lead that costs $150 and converts at 15% produces opportunities at $1,000 each. The $150 lead is three times more expensive on the CPL dashboard and two and a half times cheaper in reality. Every decision made on CPL alone, reallocating budget to the cheaper source, scaling the lower-cost channel, reporting a declining cost trend to leadership, points the team in the wrong direction.
The framework that follows decomposes lead generation cost into three layers. The first is what most teams already measure. The second is what they know exists but have not quantified. The third is what they are not seeing at all. Together, the three layers produce a number that is more honest and more useful than any industry benchmark.

The Visible Cost Layer
This is the layer that appears in the budget, gets reviewed in quarterly planning, and is divided by lead count to produce the CPL figure on the dashboard. It includes direct expenditures that are tracked and attributed to lead generation activities.
For most B2B teams, the visible cost layer consists of several categories. Tool and platform subscriptions cover the software used for prospecting, outreach, and engagement tracking. Advertising spend covers paid channels including search, social, display, and sponsored content. Data acquisition costs cover purchased contact lists, database subscriptions, and third-party intent data feeds. Agency and vendor fees cover outsourced services for content creation, campaign management, or appointment setting. Content production costs cover the creation of assets used in lead generation, from blog posts and whitepapers to webinar production and video content.
The sum of these costs divided by total leads generated is what most teams report as their lead generation cost. For a typical mid-market B2B operation, this number falls somewhere between $80 and $300 per lead depending on the industry, the channel mix, and whether in-house effort is included in the denominator.
There is nothing wrong with tracking this number. It provides a useful operational view of direct spending efficiency. The problem is that it accounts for roughly one-third to one-half of the true cost of generating a qualified opportunity. The remaining cost sits in the next two layers.
The Hidden Cost Layer
The hidden layer consists of real costs that consume budget and capacity but are not attributed to lead generation in the team's accounting. They appear in other line items, usually headcount and overhead, or they are not measured at all.
Human Time Cost
The most significant hidden cost is the time that salespeople and marketing staff spend on activities that support lead generation but are classified as "sales" or "marketing" in the org chart rather than "lead generation" in the budget. When an SDR spends the first three hours of the day researching target companies, looking up contact information, cross-referencing internal records to avoid duplicating a colleague's outreach, and entering data into tracking systems, those hours carry a fully loaded salary cost. That cost is real, but it does not appear in the lead generation budget. It appears in the sales headcount budget.
For teams operating at the earlier stages of process automation, this hidden time cost can equal or exceed the visible cost layer. If an SDR earning $70,000 in total compensation spends half their time on research and data management rather than prospect engagement, $35,000 per year in salary cost is effectively a lead generation expense that never appears in the lead generation budget.
The Quality Tax
The second hidden cost is the time consumed by leads that pass through the funnel but never had a realistic chance of converting. Every lead that marketing qualifies and sales subsequently rejects has already consumed follow-up time, discovery call time, internal discussion time, and handoff coordination time. This is a direct cost of scoring inaccuracy, and it compounds with volume. A team processing 500 MQLs per quarter with a 40% sales rejection rate is spending roughly 200 units of sales capacity on leads that will not produce pipeline. At an average of two hours of sales time per rejected lead, that is 400 hours per quarter, the equivalent of a quarter of a full-time employee's total working time, spent generating zero return.
The quality tax is the cost dimension that connects most directly to lead quality problems. It is also the cost that improves most dramatically when scoring and qualification are rebuilt on revenue data rather than engagement proxies.
Data Maintenance Cost
The third hidden cost is data decay. Enrichment data is not a one-time investment. Contact information becomes outdated as people change roles, companies restructure, and firmographic attributes shift. Industry estimates suggest that B2B contact data degrades at roughly 25 to 30 percent per year. A database that is not actively maintained becomes progressively less valuable, leading to higher bounce rates, lower response rates, and wasted outreach effort. The cost of maintaining data freshness is a recurring lead generation expense that most teams either absorb invisibly into operational overhead or ignore entirely until deliverability problems force a cleanup.
The Opportunity Cost Layer
The third cost layer is the hardest to measure and often the largest. Opportunity cost is the revenue that the team does not earn because of constraints in the lead generation process. Unlike hidden costs, which represent real spending that is misattributed, opportunity costs represent potential that is never realized.
Speed Cost
The time between when a prospect becomes active and when the team makes first contact is a cost measured in conversion probability. Research across B2B sales consistently shows that response speed correlates with contact and conversion rates. A team that takes 48 hours to follow up on a high-intent signal is operating in a different conversion probability environment than one that responds within an hour. The difference in conversion rates, applied across the full volume of high-intent signals, translates directly into pipeline that was available but not captured.
Speed cost is particularly acute for teams covering multiple time zones. A prospect in a different region who becomes active outside the team's working hours may wait 12 to 16 hours for a response. During that interval, a competitor with continuous coverage may have already initiated contact. The revenue difference between being first and being third to respond does not appear in any cost report, but it is one of the largest economic forces acting on the pipeline.
Coverage Cost
Coverage cost is the revenue lost because the team's capacity limits which markets, verticals, or company segments it can actively pursue. A team with five SDRs that could productively sell into eight industry verticals has made an implicit decision to leave three verticals unworked, or to work all eight at a level of effort too thin to produce results. Either way, the revenue from the uncovered or undercovered segments is an opportunity cost of the current process architecture.
This cost becomes visible when teams attempt to expand. The headcount trap in people-driven lead generation explains why adding SDRs to cover more segments produces diminishing returns. The coverage cost does not shrink proportionally with headcount because coordination costs and quality variance increase with team size. The gap between "markets we could sell into" and "markets we are effectively selling into" is a structural opportunity cost that scales with the company's growth ambitions.
Capability Misallocation Cost
The third opportunity cost is using expensive human judgment on tasks that do not require it. An SDR who spends two hours researching a company that an automated system could profile in seconds is producing the same output at a significantly higher cost. More importantly, those two hours of judgment capacity are not available for the high-value activities where human skill genuinely matters: navigating complex organizational dynamics, reading between the lines in a prospect conversation, and making strategic decisions about which accounts deserve deeper investment.
Capability misallocation is a cost of process design, not individual performance. The most talented SDR on the team is subject to the same constraint. Their superior judgment is diluted across tasks that range from trivial to strategic, rather than concentrated on the activities where it produces the highest return.

Calculating Cost per Qualified Opportunity
The metric that integrates all three layers is cost per qualified opportunity: the total resources consumed to produce one opportunity that enters the pipeline, is accepted by sales, and has a realistic path to close.
The calculation starts with the visible layer. Total direct lead generation spend over the measurement period, divided by the number of qualified opportunities produced. This is the baseline that most teams already have.
The hidden layer adds three adjustments. First, the portion of sales and marketing salary cost attributable to lead generation support activities, estimated by time allocation. Second, the quality tax, calculated as rejected-MQL volume multiplied by average sales time consumed per rejection, multiplied by the hourly fully loaded cost of sales time. Third, data maintenance costs, including both the direct cost of re-enrichment and the productivity cost of outreach sent to outdated contacts.
The opportunity layer is harder to quantify precisely, but directional estimates are possible. Speed cost can be approximated by comparing conversion rates at different response time intervals and multiplying the gap by lead volume and average deal size. Coverage cost can be estimated by sizing the addressable market segments the team is not actively working. Capability misallocation can be estimated by calculating the salary cost of time spent on tasks that could be automated.
The resulting number, cost per qualified opportunity with all three layers included, is typically two to three times higher than the visible-layer CPL. More importantly, it reveals where the cost is concentrated. If the hidden layer dominates, the priority is improving scoring accuracy and automating data management. If the opportunity layer dominates, the priority is expanding capacity through process automation rather than headcount. If the visible layer dominates, the team's direct spending is genuinely the primary efficiency lever, and traditional CPL optimization is the right approach.
The most valuable output of this analysis is not the number itself but the distribution across layers. A structured audit that diagnoses where the process is failing becomes significantly more actionable when paired with a cost analysis that quantifies how much each failure is costing. The audit tells you what is broken. The cost analysis tells you what it is worth to fix.

From Cost Analysis to Investment Decision
The economics of lead generation ultimately serve a decision. Whether that decision is to increase budget, reallocate spend across channels, invest in automation, restructure the team, or maintain the current approach, it requires a framework that goes beyond "our CPL is above or below the industry average."
The three-layer cost analysis provides that framework. The visible layer establishes what the team is spending directly. The hidden layer reveals what it is spending indirectly through time, quality failures, and data decay. The opportunity layer quantifies what it is leaving on the table through speed, coverage, and capability constraints.
From these three layers, three decision outputs follow.
The first is a current-state cost baseline: the true cost per qualified opportunity with all layers included. This is the honest number that replaces the CPL figure on the dashboard when the conversation turns to strategic investment.
The second is a projected cost under a changed approach: if the team upgrades one layer of its lead generation process, whether that is automating data acquisition, rebuilding the scoring model, or orchestrating multi-channel outreach, how does the cost per qualified opportunity change? The three-layer framework makes this projection specific. Automating data reduces the hidden human time cost. Improving scoring reduces the quality tax. Expanding automation-driven coverage reduces the opportunity cost of unworked segments.
The third is a payback period: how long before the investment in process improvement recovers its cost through reduced cost per qualified opportunity and increased pipeline volume. For leadership conversations, payback period is the most persuasive economic argument because it anchors the investment in time rather than abstract percentages. "This investment pays for itself in five months" is a more actionable statement than "this investment has a projected ROI of 240%."
The economics of lead generation are not a one-time analysis. Market conditions shift, team composition changes, and the process itself evolves. The three-layer framework should be revisited at the same cadence as the operational audit, quarterly or whenever a significant change to the process is under consideration. The teams that sustain the best unit economics are the ones that measure all three layers continuously, not the ones that happened to find the cheapest CPL benchmark source.
Read More
AI Sales Agents: Complete Buyer's Guide
Global Outbound Sales in 2026: What Actually Scales and What Doesn't
Explore more Selling Skills insights here.