How to Run Global Outbound Scaling Diagnostic with Your Team
by Stella L
15-minute team diagnostic reveals whether you have a scalable sales system or tool stack. Score-base…
Introduction
You don't need a perfect process to diagnose whether your sales infrastructure scales or replicates.
You need: fifteen minutes, five people, and honest answers.
Most diagnostics fail not because the framework is weak, but because teams don't know how to run them, interpret results, or act on findings. The assessment becomes another meeting that changes nothing.
This guide provides the essential execution pathway: how to run the diagnostic, what your score means, and exactly what to do based on your results.
The Essential Diagnostic (Streamlined)
Bare Minimum Requirements
Who should participate:
- You (facilitator)
- 1-2 sales leaders
- 2-3 frontline reps (different markets/tenures)
- 1 operations person (if available)
Total: 5-7 people maximum
When to run it: Next available fifteen-minute slot. Mid-week, mid-morning works best. Avoid Mondays (too much context-switching) and Fridays (mental checkout).
What you need:
- Shared screen or whiteboard for scoring
- Simple scoring sheet (track points as you go)
- Timer (keep it to fifteen minutes)
- Commitment to psychological safety
How to frame it: Send calendar invite: "Sales Infrastructure Health Check – 15 min"
In the invitation: "We're assessing our systems, not individual performance. Your honest input determines whether we optimize what we have or redesign our approach."
This framing matters. Without explicit safety, you get politically correct answers instead of truth.
The 10 Questions (Quick Reference)
Run through these questions rapidly. Don't debate answers. Capture them, score them, move forward.
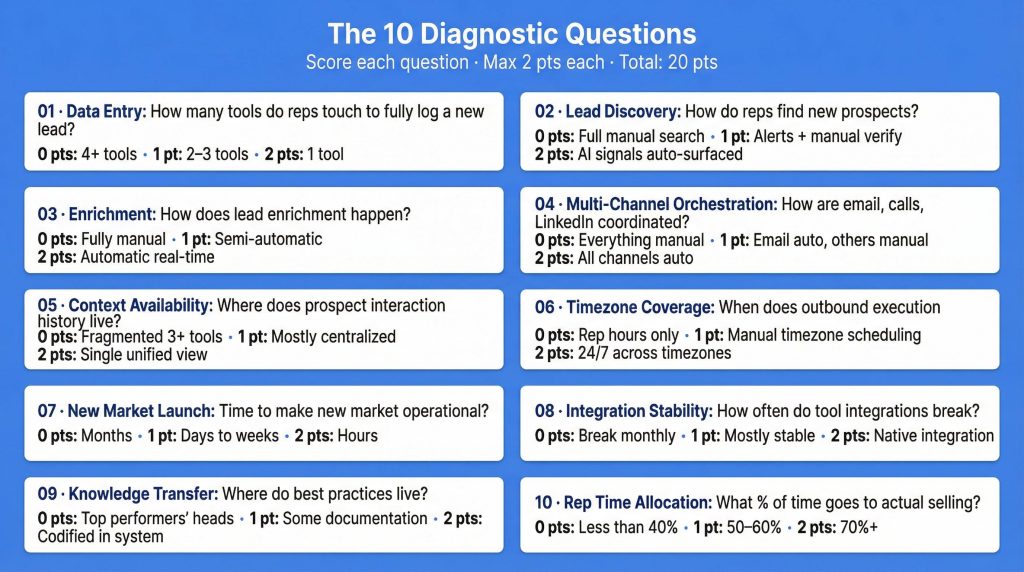
Question 1 – Data Entry: How many tools do reps touch to fully log a new lead?
- 1 tool = 2 points
- 2-3 tools = 1 point
- 4+ tools = 0 points
Question 2 – Lead Discovery: How do reps find new prospects?
- AI signals automatically surfaced = 2 points
- Alerts set up, reps manually verify = 1 point
- Full manual search = 0 points
Question 3 – Enrichment: How does lead enrichment happen?
- Automatic with real-time updates = 2 points
- Semi-automatic, some manual work = 1 point
- Fully manual across multiple tools = 0 points
Question 4 – Multi-Channel Orchestration: How are email, calls, LinkedIn coordinated?
- All channels orchestrated automatically = 2 points
- Email automated, others manual = 1 point
- Everything manual = 0 points
Question 5 – Context Availability: Where does prospect interaction history live?
- Complete history in single unified view = 2 points
- Most centralized, some gaps = 1 point
- Fragmented across 3+ tools = 0 points
Question 6 – Timezone Coverage: When does outbound execution happen?
- System operates 24/7 across timezones = 2 points
- Can schedule for other timezones manually = 1 point
- Only during rep working hours = 0 points
Question 7 – New Market Launch: Time to make new market operational?
- Hours (inherits all learning) = 2 points
- Days to weeks (some setup required) = 1 point
- Months (rebuild entire workflow) = 0 points
Question 8 – Integration Stability: How often do tool integrations break?
- Native integration, updates improve workflow = 2 points
- Mostly stable, occasional issues = 1 point
- Break monthly, require IT fixes = 0 points
Question 9 – Knowledge Transfer: Where do best practices live?
- Codified in system, applied automatically = 2 points
- Some documentation, incomplete = 1 point
- In top performers' heads only = 0 points
Question 10 – Rep Time Allocation: What percentage of time goes to actual selling?
- 70%+ on selling = 2 points
- 50-60% on selling = 1 point
- Less than 40% on selling = 0 points
Speed Facilitation Method
Ask the question clearly
Read it verbatim. Don't editorialize.
Start with frontline reps
Not leadership. Reps experience daily reality.
Quick show of hands
"Who thinks we're at 0 points? 1 point? 2 points?"
Take the mode
Most common answer becomes the score. Don't average—that hides consensus or disagreement.
Move on
Don't debate. If there's disagreement, note it and continue. You'll interpret patterns after.
Complete in ten minutes
This leaves five minutes for quick scoring and initial reactions.
Your Score → Your Path
Add up your points across all ten questions. Maximum possible: 20 points.
Your score determines your path forward.
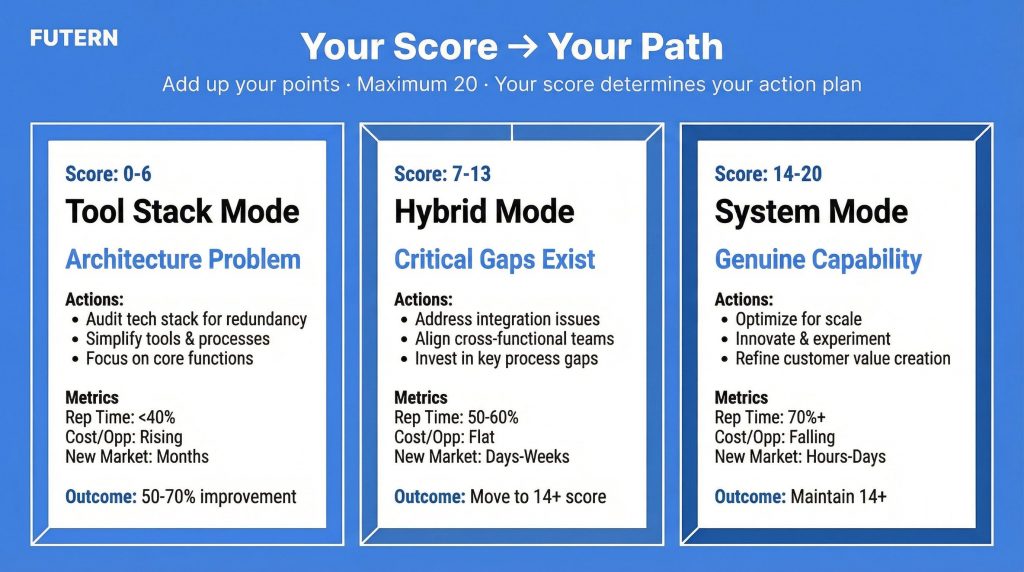
Path 1: Score 0-6 (Tool Stack Mode)
What This Score Means
You're operating in pure tool stack mode. Reps spend 40% or more of their time coordinating between tools before actual selling starts. Each new market requires rebuilding the same workflows manually. Cost per qualified opportunity is rising as you expand, not declining.
This isn't a training problem. It's an architecture problem.
The Decision You Face
Should you optimize your current stack or redesign your architecture?
Decision tree:
Q: Is your revenue above $5M and are you planning to expand to new markets?
- Yes → Redesign. Optimization won't solve structural issues. You'll spend 12-18 months optimizing a broken foundation while competitors with better infrastructure capture markets faster.
- No → You can optimize for 12-18 months to buy time, but plan for eventual redesign. Start building the business case now.
Q: Can leadership commit to a 90-day transition project?
- Yes → Full architectural redesign. Rip off the bandaid.
- No → Incremental improvements until you can. But understand: you're accumulating technical debt. The longer you wait, the harder the transition becomes.
Your 30-Day Action Plan
Week 1: Build the business case
- Audit total tool spend annually
- Calculate rep hours spent on tool coordination weekly
- Multiply hours by loaded cost per hour
- Formula: (Tool spend) + (Coordination hours × hourly cost) = True infrastructure cost
Typical finding: Teams think they spend $200K on tools. Reality including rep time: $600K+.
Week 2: Calculate cost per qualified opportunity
- Count qualified opportunities generated last quarter
- Divide total infrastructure cost by opportunity count
- Track trend: Is this number rising or falling as you expand?
If rising: You're replicating overhead, not scaling capability.
Week 3: Identify pilot workflow
- Choose highest-volume workflow (likely prospecting or enrichment)
- Document current state: steps, tools, time, error rate
- Define what systematic version looks like
- Estimate improvement potential
Week 4: Present options to leadership
- Option A: Optimize current stack (12-18 month timeline, 10-20% improvement)
- Option B: Redesign architecture (90-day timeline, 50-70% improvement)
- Recommendation with business case
- Resource requirements for each path
Expected Outcomes
3-6 months:
- Reduce coordination overhead 30-50%
- Free up 15-20 hours per rep per week
- Redirect that time to actual selling
6-12 months:
- Improve cost per qualified opportunity 40-60%
- Launch new markets in weeks instead of months
- Scale coverage without scaling headcount proportionally
12+ months:
- Enable 3-5x market coverage with same team size
- Cost per opportunity decreasing as volume increases
- Genuine systematic capability established
Path 2: Score 7-13 (Hybrid Mode)
What This Score Means
You have some systematic capability but critical gaps. Some workflows operate smoothly. Others are manual coordination nightmares. You experience "almost works" frustration—integrations that should connect tools but constantly break, automation that creates new overhead instead of eliminating it.
Scaling is possible but inefficient. You can expand, but you're not optimizing as you grow.
Gap Analysis Framework
Break down your score by dimension to identify where to invest first:
Questions 1-3 (Data Infrastructure): ___ / 6 points
- If you scored 0-2 here: Prospecting and enrichment are your bottleneck
- Priority: Fix how leads enter and get enriched
Questions 4-6 (Workflow Orchestration): ___ / 6 points
- If you scored 0-2 here: Execution and context are your bottleneck
- Priority: Fix how outreach happens and context flows
Questions 7-10 (Scaling Capability): ___ / 8 points
- If you scored 0-3 here: Scalability and knowledge transfer are your bottleneck
- Priority: Fix how learning transfers and systems adapt
Prioritization logic: Address your lowest-scoring dimension first. Don't try to fix everything simultaneously—you'll dilute focus and see no meaningful improvement anywhere.
Your 60-Day Sprint Plan
Sprint 1 (Days 1-30): Fix Lowest-Scoring Dimension
Week 1: Map current state
- Document exact workflow for that dimension
- Identify every manual step, tool switch, data re-entry
- Calculate time and error rate
- Interview reps: "What breaks most often here?"
Week 2: Design systematic version
- Define what "good" looks like (use 2-point scoring criteria as target)
- Identify tools/changes needed
- Create before/after workflow diagram
- Estimate improvement and cost
Week 3: Pilot in one market
- Implement new approach with small team (2-3 reps)
- Run parallel to old approach (don't force cutover yet)
- Measure: time saved, quality improvement, error reduction
- Collect feedback daily
Week 4: Measure and decide
- Compare pilot results to baseline
- If 30%+ improvement: Scale it
- If 10-30% improvement: Refine and retest
- If <10% improvement: Redesign approach
Sprint 2 (Days 31-60): Scale What Worked
Week 5-6: Roll pilot to all markets
- Train remaining team on new workflow
- Migrate data/configurations
- Provide support for transition
- Track adoption and results
Week 7: Address second-lowest dimension
- Apply same sprint methodology
- Build on momentum from Sprint 1
- Demonstrate continuous improvement
Week 8: Re-run diagnostic
- Score all ten questions again
- Track improvement (should see 3-5 point increase)
- Identify next sprint target
- Share wins with team and leadership
Expected Outcomes
60 days:
- Close one critical gap completely
- Move one dimension from 0-1 points to 2 points
- Demonstrate ROI to justify continued investment
120 days:
- Close second critical gap
- Move overall score from hybrid (7-13) to system (14+)
- Establish sprint rhythm for continuous improvement
6 months:
- Sustain improvements (score doesn't regress)
- Apply learnings across all workflows
- Shift from reactive fixes to proactive optimization
Path 3: Score 14-20 (System Mode)
What This Score Means
You have genuine systematic capability. Efficiency improves as you scale. New markets launch in hours or days, not months. Reps spend 70%+ of time on high-value work—qualification, relationships, strategy—instead of tool coordination.
You're not done. Even high-performing systems have optimization opportunities. The question is: how do you push from 16 to 18? From 18 to 20?
Optimization Framework
Identify bottleneck questions: Which questions scored 1 instead of 2? These represent your remaining friction points.
Assess optimization ROI: Not all improvements are worth the investment. Prioritize based on:
- Frequency: How often does this friction occur?
- Impact: How much time/money does it cost?
- Effort: How hard is it to fix?
High frequency + High impact + Low effort = Optimize immediately Low frequency + Low impact + High effort = Deprioritize
Your Continuous Improvement Rhythm
Monthly:
- Pick one workflow
- Run mini-diagnostic on just that workflow
- Identify specific friction points
- Test small improvement
- Measure impact
Quarterly:
- Full 10-question reassessment
- Track score trajectory (trending up = healthy)
- Share wins with team
- Reset optimization targets for next quarter
Annually:
- Compare Year 2 to Year 1 scores
- Assess: Are we maintaining systematic capability as we scale?
- Benchmark: How do we compare to where we were 12 months ago?
- Strategic: What new capabilities do we need for next stage of growth?
Resource Requirements
Budget: Minimal—you already have infrastructure. Focus on refinement, not replacement.
Time: 10-20% of one operations person's time for continuous optimization. This isn't a project; it's a permanent function.
Culture: Continuous improvement mindset. Encourage team to identify friction points proactively.
Expected Outcomes
Maintain 14+ score as you scale Many teams score high at 20 reps, then regress to 10-12 as they grow to 50 reps. Continuous measurement prevents this.
Push toward 18-20 over 12 months Incremental improvements compound. Each quarter, target 1-2 point increase.
Competitive advantage High-scoring systems scale faster than competitors. You can enter new markets in weeks while competitors take months. This compounds over time.
Common Scenarios and Quick Solutions
Scenario 1: Low Score, No Budget for Change
Focus on process standardization (costs nothing):
- Document your best performer's workflow
- Replicate what works across team
- Eliminate unnecessary steps
- Standardize tool usage
Build business case concurrently:
- Calculate true cost of current state
- Project savings from systematic approach
- Present quarterly until budget approved
Timeline: 6-12 months of process optimization while building case for tools.
Scenario 2: High Score, Planning Major Expansion
Stress-test your system at 2x scale:
- Will current infrastructure handle double the volume?
- Which component breaks first?
- What capacity constraints exist?
Invest in capacity, not new tools:
- If you score 16/20, don't add tools—you'll create new coordination overhead
- Instead, scale what works: more licenses, more capacity, better training
Timeline: Test capacity before expansion, not during.
Scenario 3: Mixed Scores Across Markets
Document high-scoring market's approach:
- What do they do differently?
- Is it replicable or market-specific?
- Who's the champion making it work?
Transfer learnings systematically:
- Don't just "share best practices"—codify them in the system
- Make the high-scoring approach the standard
- Identify what needs market customization vs what should be universal
Timeline: 30-60 days to standardize across markets.
Scenario 4: Low Time Allocation Despite Automation
Audit what's "automated": Often automation that doesn't integrate creates new overhead—reps now manage automation instead of doing work manually.
The test: Can reps explain what each "automation" actually does? If not, it's waste.
The fix: Simplify before adding more automation. Sometimes removing tools improves efficiency.
Timeline: Immediate—elimination is faster than addition.
Making It Stick: Quarterly Rhythm
Quarter 1: Baseline
- Run diagnostic (score: X/20)
- Identify top 3 gaps
- Fix 1 gap completely
Quarter 2: Expand
- Re-run diagnostic (score: X+3/20)
- Validate improvement
- Fix gap #2
Quarter 3: Scale
- Apply learnings across all markets
- Measure consistency (all markets converging on similar scores?)
- Fix gap #3
Quarter 4: Optimize
- Fine-tune what's working
- Identify new opportunities revealed by fixes
- Set targets for next year
Tracking Dashboard
Build simple quarterly tracker:
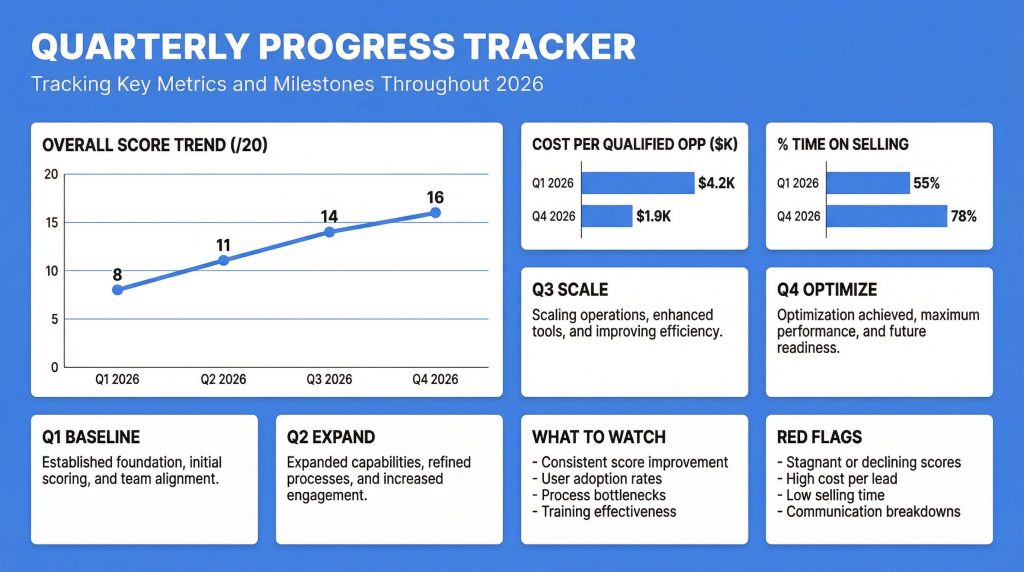
| Quarter | Overall Score | Data (Q1-3) | Workflow (Q4-6) | Scale (Q7-10) | Cost/Opp | % Time Selling |
| Q1 2026 | 8/20 | 2/6 | 2/6 | 4/8 | $4,200 | 55% |
| Q2 2026 | 11/20 | 4/6 | 3/6 | 4/8 | $3,100 | 65% |
| Q3 2026 | 14/20 | 5/6 | 5/6 | 4/8 | $2,400 | 72% |
| Q4 2026 | 16/20 | 6/6 | 5/6 | 5/8 | $1,900 | 78% |
What to watch:
- Overall score trending up consistently
- Dimension scores converging (no single bottleneck)
- Cost per opportunity trending down
- Time on selling trending up
Red flags:
- Score improvement stalls for 2+ quarters
- One dimension stuck at 0-1 despite improvement elsewhere
- Cost per opportunity rising despite score improvements (something else is broken)
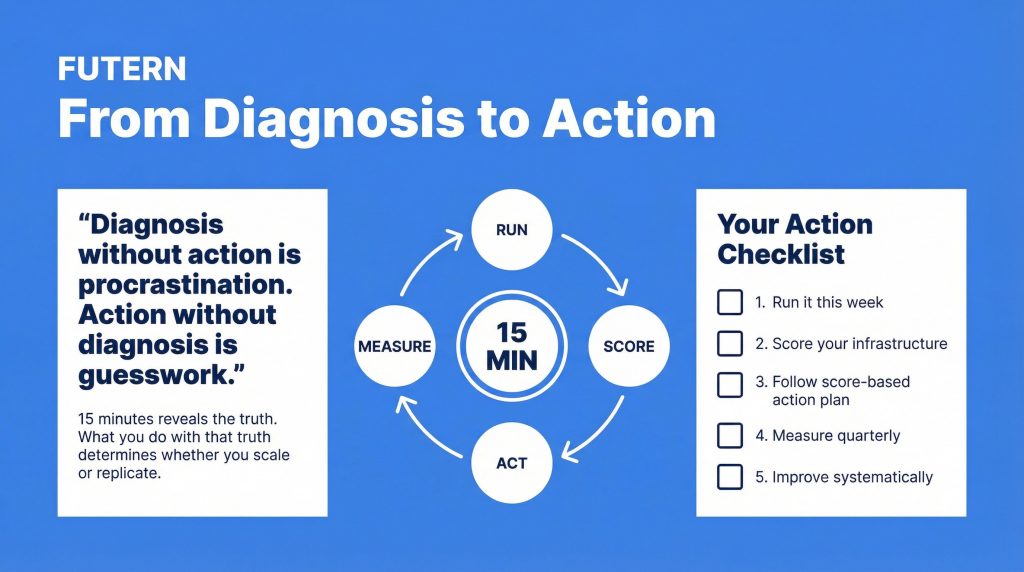
Closing: From Diagnosis to Action
Diagnosis without action is procrastination. Action without diagnosis is guesswork.
This fifteen-minute diagnostic gives you clarity on what you're working with. Your score determines your path. Your execution determines your outcomes.
The choice:
- Run it this week
- Score your infrastructure honestly
- Follow your score-based action plan
- Measure quarterly
- Improve systematically
Teams that measure infrastructure health proactively scale efficiently. Teams that don't discover problems only after they've replicated overhead across a dozen markets.
Fifteen minutes reveals the truth. What you do with that truth determines whether you scale or replicate.
Continue Learning
Understand what creates tool stacks vs systems:
Learn how to measure system health ongoing:
Discover what systematic infrastructure looks like:
Or see how Futern's AI Sales Agent provides the orchestration layer that turns tool stacks into integrated systems: Explore Futern.