Measuring Whether Your Global Outbound System Actually Scales (The 3-Question Framework)
by Stella L
Three questions reveal if your global outbound truly scales or just replicates broken playbooks. Mea…
Introduction
"We're up 40% in pipeline. We're scaling."
But underneath that metric, a different story often unfolds: pipeline quality dropped 60%, cost per opportunity rose 35%, and your best reps spend 65% of their time on work that shouldn't require their expertise.
Most teams measure outputs: pipeline, deals, revenue. These are lagging indicators. High-performing teams measure system health, leading indicators that predict whether your model will scale or break.
This article presents a 3-question framework to measure whether your global outbound system truly scales. Each question reveals problems 6 months before traditional metrics show them.
Question 1: Is Your Pipeline Quality Improving or Fragmenting?
The Test
Pipeline volume is seductive—it's easy to track and naturally increases when you add markets. But volume without quality is noise.
Pull 6 months of pipeline data and track three metrics together:
- Pipeline volume (baseline—what leadership watches)
- Average deal size by region and rep cohort
- Win rate by cohort (market entry date, rep tenure, opportunity source)
The Pattern
✅ Scaling: Volume ↑ 40%, deal size stable, new market win rate reaches 70-80% of baseline within 6 months
❌ Fragmenting: Volume ↑ 40%, deal size ↓ 25-35%, new market win rate stuck at 30-50% after 9+ months
Why This Matters
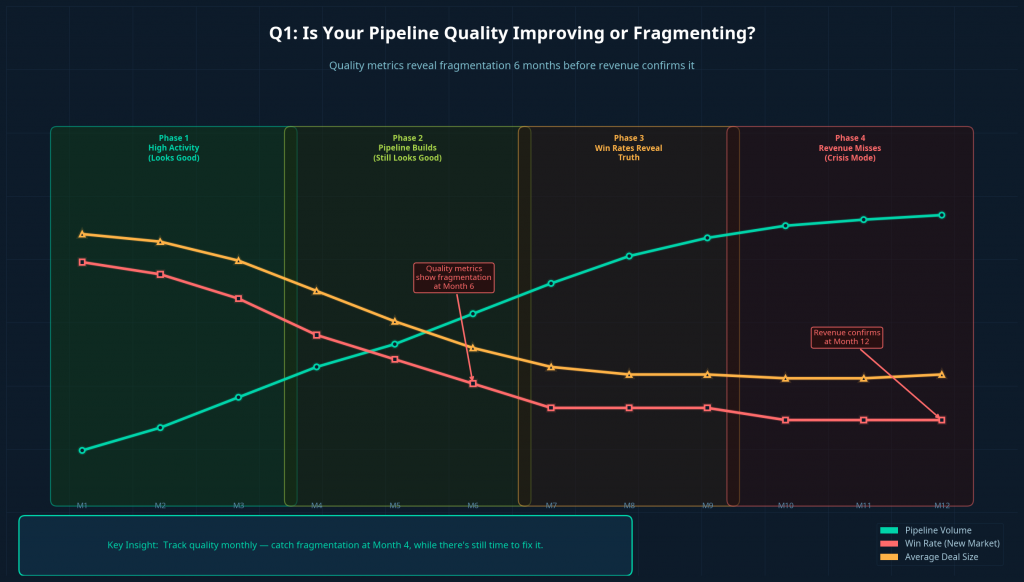
Fragmentation appears in quality metrics 6 months before revenue. Timeline:
- Month 1-3: High activity (looks good)
- Month 4-6: Pipeline builds (still looks good)
- Month 7-9: Win rates reveal truth (problem visible)
- Month 10-12: Revenue misses (crisis mode)
Track quality monthly, catch fragmentation at Month 4, while there's time to fix it.
Real Example
Your US team: mid-market SaaS, 18% win rate, $65K deals. EMEA expansion with same filters grows to 120 opportunities by Month 6.
But: EMEA deal size $28K (57% lower), win rate 6% after 9 months. The ICP didn't translate—German "100-500 employees" means different companies than US equivalents.
Quality metrics showed this at Month 6. Revenue confirmed at Month 12.
If You're Fragmenting
This signals ICP failure. You need market-specific qualification, not translated US criteria. The fix: redesign targeting before continuing expansion, likely requiring AI prospecting that understands local context.
Question 2: Is Your Cost per Result Decreasing or Increasing?
The Test
True scaling improves unit economics. Track monthly for 12 months:
- Cost per qualified opportunity:
(Total opex) ÷ (Qualified opps)by region and cohort - CAC payback period: Is it shortening or lengthening?
The Pattern
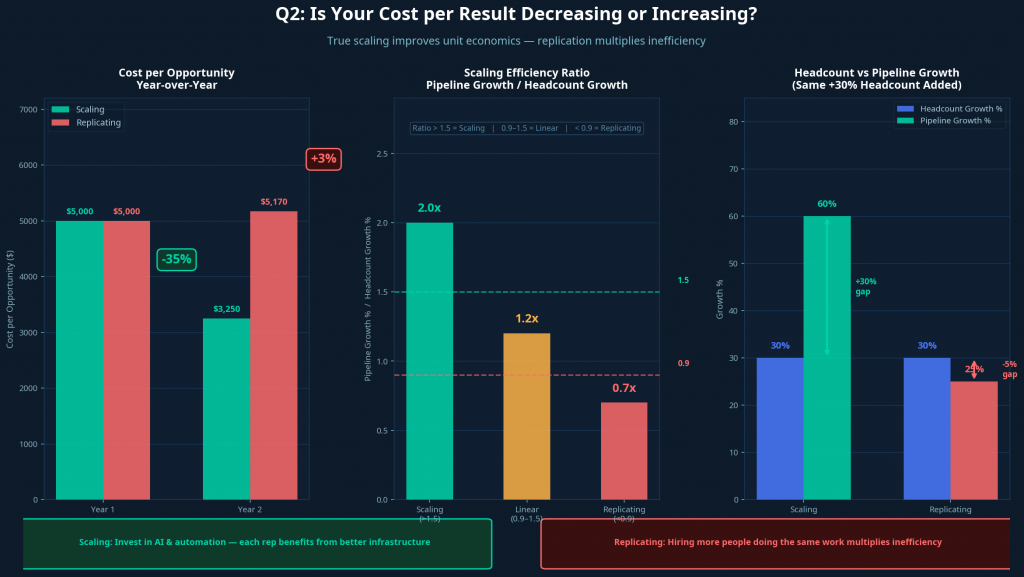
✅ Scaling: Cost per opp ↓ 15-25% annually, new markets reach 80% efficiency within 9 months, headcount +30% while pipeline +60%
❌ Replicating: Cost per opp flat or rising, new markets at 40-50% efficiency after 12+ months, headcount +30% while pipeline +25-35%
Why This Matters
Scaling example:
- Year 1: 10 reps, $500K opex, 100 opps → $5K per opp
- Year 2: 15 reps, $650K opex, 200 opps → $3.25K per opp (-35%)
Invested in systems (AI prospecting, automation). Each rep benefits from better infrastructure.
Replicating example:
- Year 1: 10 reps, $500K opex, 100 opps → $5K per opp
- Year 2: 15 reps, $750K opex, 145 opps → $5.17K per opp (+3%)
Hired more people doing same work. No systematic improvement.
Simple diagnostic: (Pipeline growth %) ÷ (Headcount growth %)
- Ratio >1.5 = scaling
- Ratio 0.9-1.5 = linear growth
- Ratio <0.9 = inefficient replication
If Costs Are Rising
This signals replication without systematic improvement. According to Outreach research, traditional teams spend only 33% of time selling—the rest on overhead. Replicating this globally multiplies inefficiency.
The fix: AI agents for execution (prospecting, enrichment, sequences) while humans focus on judgment. Companies report 60% cost reduction with 10x coverage expansion.
Question 3: Is Your Team's Time Shifting to Higher-Value Work?
The Test
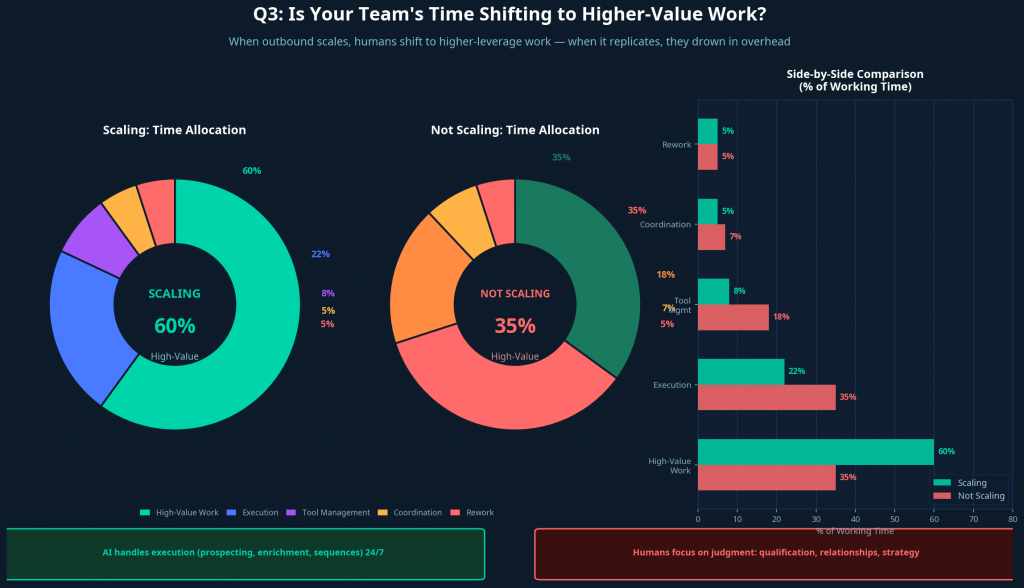
When outbound scales, humans shift to higher-leverage work. When it replicates, they drown in overhead.
Run a monthly 5-question survey with your team:
- % time on work only you can do (qualification, relationships, strategy)
- % time on execution (data entry, list building, CRM updates)
- % time on tool management (switching tools, troubleshooting)
- % time on coordination (waiting for responses, handoffs)
- % time on rework (re-entering data, fixing errors)
The Pattern
✅ Scaling:
- High-value work: 55-65% (stable or increasing)
- Execution: 20-25% (decreasing)
- Tool management: <10% (decreasing)
- Coordination: 10-15% (stable)
- Rework: <5% (decreasing)
❌ Not Scaling:
- High-value work: 30-40% (decreasing)
- Execution: 30-40% (increasing)
- Tool management: 15-20% (increasing)
- Coordination: 15-20% (increasing)
- Rework: 10-15% (stable or increasing)
Why This Matters
Gartner research: sales reps spend 40% of time manually finding leads, but globally this exceeds 50%. If time allocation worsens as you scale, your systems are scaling operational burden, not capability.
According to Belkins, single-touch converts at 1.07%, multi-channel at 5%+. But executing multi-channel manually buries humans in work. AI-augmented models solve this: AI handles execution (24/7 sequences), humans handle judgment (qualification, relationships). Same team, 5-10x pipeline.
If Allocation Worsens
This signals work distribution failure. You're adding volume without systematic capability. The fix: let AI handle prospecting, enrichment, signals, and engagement. Humans receive qualified opportunities and focus on strategy.
Synthesis: What Your Answers Reveal
Now that you've assessed your system across all three dimensions, here's how to interpret your results:
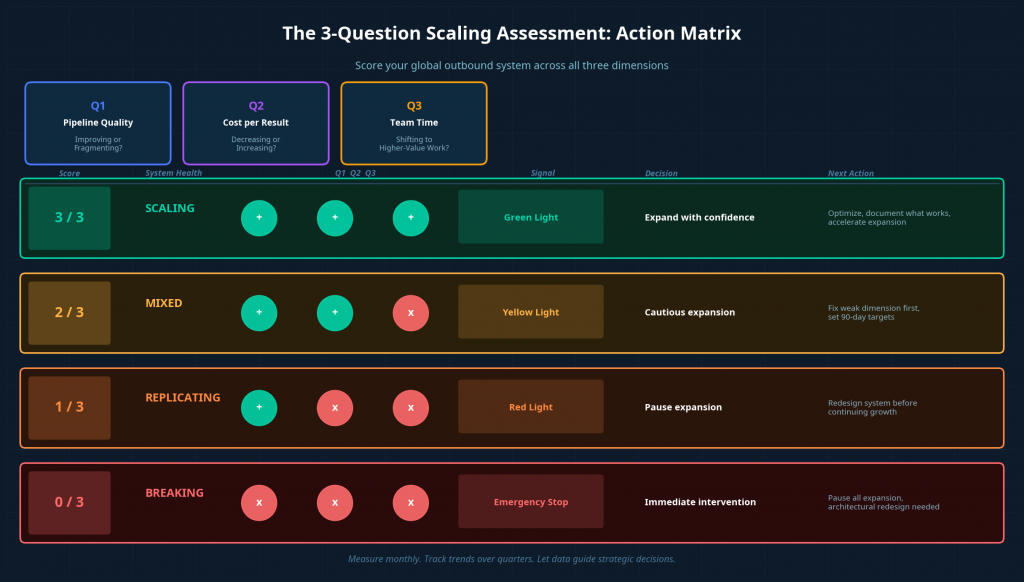
All 3 Questions Positive: Your System Is Scaling
✅ Pipeline quality improving or stable
✅ Cost per opportunity decreasing
✅ Team time shifting to higher-value work
What this means: You've built genuine scaling infrastructure. Your operational model improves with volume. Continue optimizing, maintain measurement discipline, and you can confidently expand.
Next steps:
- Document what's working (it's transferable competitive advantage)
- Identify remaining bottlenecks and systematically remove them
- Consider accelerating expansion—your system can handle it
2 Out of 3 Positive: Your System Has Weaknesses
Common patterns and fixes:
- Quality + Cost good, Time bad: Scaling economically but burning team → Fix: Automate execution
- Quality + Time good, Cost bad: Good opportunities, inefficient process → Fix: Add systematic efficiencies
- Cost + Time good, Quality bad: Efficient but wrong targets → Fix: Redesign ICP first
Address weaknesses before expanding, they compound under growth. Set 90-day targets and retest.
1 Out of 3 or 0 Out of 3 Positive: You're Replicating, Not Scaling
❌ Pipeline fragmenting
❌ Costs rising or flat
❌ Team time shifting to lower-value work
What this means: You're expanding geographically but not systematically. Each new market copies a broken playbook. Costs rise linearly (or faster) with presence. The operational model will break under continued growth.
This is common. Most teams discover they're replicating only after 12-18 months of "growth" that produced activity but not sustainable results.
Next steps:
- Pause major expansion. Don't add markets or significant headcount until you redesign.
- Run the diagnostic audit from the article "What Fails First When Global Outbound Tries to Scale"—identify which specific failure modes are active.
- Redesign in this order:
- First: Fix signal quality (ICP, targeting, qualification)
- Second: Fix execution continuity (automate workflows, remove timezone dependencies)
- Third: Fix work allocation (introduce AI for execution, free humans for judgment)
- Measure monthly using this 3-question framework. Don't expand until you see 2+ questions trending positive for 3+ consecutive months.
The role of AI in recovery:
Companies in this position often need architectural intervention, not incremental optimization. AI sales agents can provide the execution layer that enables redesign:
- AI handles prospecting globally with market-specific signal understanding
- AI maintains execution continuity 24/7 across all timezones
- AI manages multi-channel sequences, freeing humans for qualification and relationships
Expected timeline: 3-6 months from AI implementation to seeing 2+ questions trend positive.
The Action Matrix: What to Do Based on Your Score
Advanced Indicators: Leading vs. Lagging Pairs
For deeper measurement, track leading/lagging indicator pairs:
- Signal Quality: % outreach based on <7-day signals (leading) → Win rate by signal age (lagging, 60-90 days later)
- Execution Continuity: Response time by timezone (leading) → Deal velocity (lagging, 30-45 days later)
- Work Allocation: % automated workflows (leading) → Revenue per employee (lagging, 90-120 days later)
Track leading indicators monthly. They predict lagging indicators 1-3 quarters out.
How to Set Your Own Benchmarks
No industry data? Use your own:
- Pick your best-performing market (highest win rate, best economics)
- Measure all metrics there for 3 months—this is your baseline
- Compare other markets: 60% of baseline = needs time, 80% = healthy, 40% after 9 months = targeting problem
- Track velocity: Month 3 at 40% → Month 6 at 65% → Month 9 at 80% = on track
This self-referential approach works because you compare to your own proven performance, not external standards that may not apply.
The Quarterly Review Process
Make this framework a rhythm:
- Monthly: Pull 3 core metrics, note trends, flag issues (15 min)
- Quarterly: Full scorecard with leadership, deep dive on negatives, decide: expand/consolidate/redesign? (2 hours)
- Annually: Compare year-over-year, assess genuine scaling vs. growth, reset targets (half-day)
This ensures measurement informs decisions before problems compound.
Closing: Three Questions, Measured Monthly, Predict Scale 6 Months Out
Most teams discover they're not scaling when it's too late—after burning budget, missing targets, and exhausting their team.
The three questions in this framework give you a different path:
Question 1 reveals whether your targeting and qualification maintain quality as you expand—or whether you're generating volume without value.
Question 2 reveals whether your economics improve with scale—or whether you're replicating expensive manual operations across markets.
Question 3 reveals whether your team's expertise shifts to high-leverage work—or whether operational overhead is drowning them in execution tasks.
Measure these monthly. Track trends over quarters. Let the data guide strategic decisions.
If the answers are positive, you've built genuine scaling infrastructure—expand with confidence.
If the answers are mixed, you have 90 days to address weaknesses before they compound under growth.
If the answers are negative, you're replicating—pause expansion and redesign the system before continuing.
Measurement clarity enables proactive decisions. The teams that measure system health catch problems early and redesign before crisis. The teams that only measure outputs discover fragmentation, cost explosions, and burnout after months of "growth" that wasn't sustainable.
Three questions. Measured monthly. The truth about whether your global outbound system actually scales.
Continue Learning
Explore how measurement connects to system design:
- What Fails First When Global Outbound Tries to Scale
- What Actually Scales Global Outbound Sales in 2026
- The Role of AI Sales Agents in Global Outbound Systems
Or see how Futern's AI Sales Agent helps teams improve all three dimensions: Discover Futern.