The Real Cost of Low-Quality Leads in B2B Sales
by Stella L
Hidden and compounding costs of low-quality leads beyond wasted time.
Ask any sales leader what bad leads cost their team, and the answer almost always centers on time. SDRs spend hours researching and reaching out to prospects who were never going to buy. Account executives sit through discovery calls that go nowhere. Pipeline reviews surface opportunities that have been sitting at the same stage for months. The time cost is real, visible, and the first thing anyone mentions.
But time is the smallest and most measurable layer of a much larger cost structure. Low-quality leads create a chain of consequences that extends well beyond the hours spent on them. They distort pipeline forecasts in ways that lead to wrong resource decisions. They corrupt ICP definitions gradually enough that the drift goes unnoticed for quarters. They displace genuine opportunities by consuming the bandwidth that should have gone to better prospects. And they change how sales teams behave, creating patterns of caution and distrust that persist long after any individual bad lead has been disqualified.
The full cost of low-quality leads is difficult to calculate precisely because much of it is hidden inside other metrics. A forecast miss gets attributed to execution. A declining conversion rate gets attributed to competition. A demoralized SDR team gets attributed to management. In each case, the underlying driver may be lead quality, but the symptom shows up somewhere else entirely.
The Costs Everyone Counts
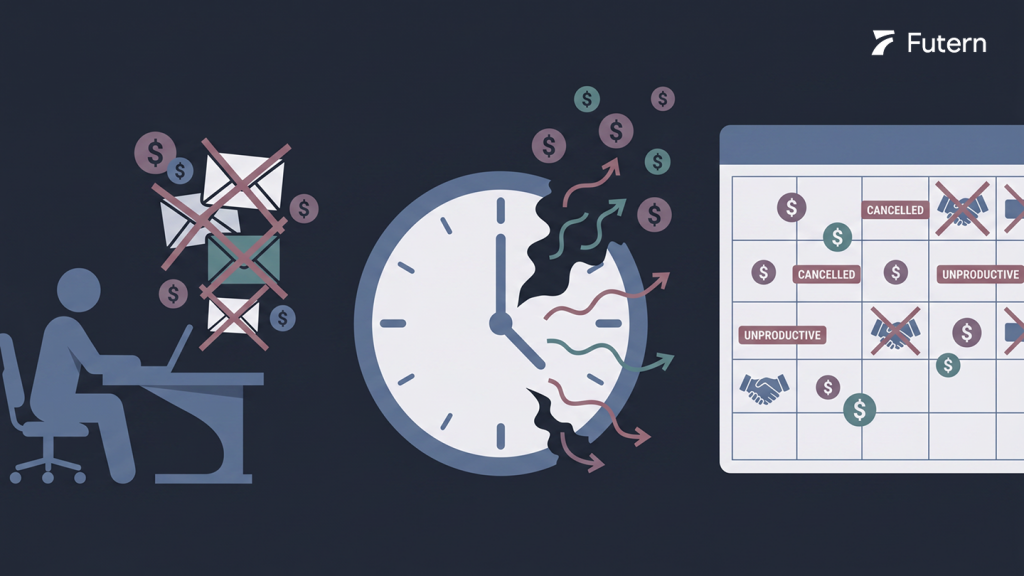
The visible costs of low-quality leads are straightforward to quantify, which is why they dominate most discussions of lead quality.
SDR time is the most commonly cited. When a sales development representative spends 20 minutes researching a prospect, crafts a personalized outreach sequence, follows up three times, and eventually gets a meeting that reveals the prospect has no budget, no authority, or no relevant problem, that entire investment is lost. Multiply this across a team of ten SDRs working 200 leads per month, and even a modest unqualified rate of 30 percent translates to roughly 400 wasted hours per quarter. At fully loaded SDR compensation, that is a six-figure annual cost in labor alone.
Outreach resource consumption adds another layer. Email sends, LinkedIn InMail credits, phone time, and sales engagement platform seats all have direct costs tied to volume. When a meaningful percentage of that volume is directed at prospects who will never convert, the per-qualified-lead cost rises accordingly, but the increase is absorbed into the overall outreach budget rather than being tracked against lead quality.
Meeting slot displacement is slightly less obvious but equally real. Sales calendars have finite capacity. When an account executive's week includes three discovery calls with unqualified prospects, those slots were not available for qualified ones. The cost is not just the time spent in the meeting but the preparation time before it, the follow-up after it, and the cognitive transition between a dead-end conversation and the next productive one. Account executives who run back-to-back meetings with mixed-quality prospects carry the residue of the unproductive ones into the productive ones, arriving at a genuine opportunity with less energy and less preparation than it deserved.
The reason these costs dominate the conversation about lead quality is that they are the only ones with clear attribution. A wasted meeting can be traced back to a specific lead, a specific source, and a specific qualification decision. The team can point to it, quantify it, and resolve to prevent it. This clarity creates a false sense that the cost of bad leads is understood and managed. In most organizations, the visible costs are treated as an acceptable overhead, a cost of doing business that is offset by the good leads that do convert. What this framing misses is that the visible layer accounts for a minority of the total damage.
These costs are genuine, and in aggregate they are significant. But they share a common characteristic: they are bounded and linear. Each bad lead wastes a roughly predictable amount of time and resources. The costs that follow are neither bounded nor linear.
The Costs That Get Blamed on Something Else
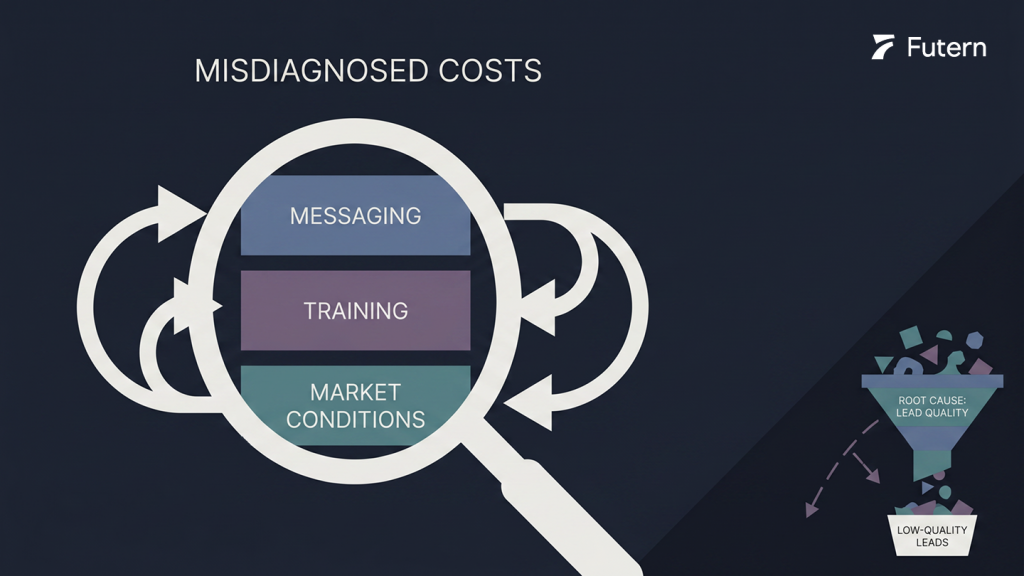
When lead quality degrades, the symptoms rarely present themselves as a lead quality problem. They surface in adjacent metrics, get interpreted through other lenses, and trigger responses that address the wrong root cause.
Conversion Rates Blamed on Messaging
Conversion rate decline is the most common misattribution. When the percentage of leads that advance from qualification to opportunity drops, the standard diagnosis is that messaging is not resonating, the competitive landscape has shifted, or the sales team needs more training. All of these can be true, and sometimes are. But when the underlying cause is that a higher proportion of leads entering the pipeline were never a good fit in the first place, no amount of messaging refinement or sales training will restore the previous conversion rate. The team is solving for a messaging problem when it actually has a targeting problem.
Forecast Misses Explained by Market Conditions
Forecast misses follow a similar pattern. Sales leaders build forecasts based on pipeline value and historical conversion rates. When pipeline quality degrades without anyone adjusting the conversion assumptions, the forecast overestimates revenue. The subsequent miss gets attributed to deal slippage, longer sales cycles, or market softness. These explanations are plausible enough that they are rarely challenged, but they obscure the structural issue: the pipeline contained deals that were never going to close at the assumed rate because they should not have been in the pipeline at all.
Sales Cycles That Lengthen Without Clear Cause
Lengthening sales cycles are another downstream indicator. When an account executive works a deal with a prospect whose fit is marginal, the sales process takes longer because alignment is harder to achieve. The prospect hesitates not because of a solvable objection but because the product genuinely does not match their priority. These deals drag on, consuming attention and follow-up bandwidth, and when they eventually stall or close-lost, the cycle time inflation gets recorded as a sales execution issue rather than a lead quality issue.
The common thread across these misattributions is that each one triggers an organizational response in the wrong direction. Messaging gets rewritten when targeting should be tightened. Training programs get launched when scoring models should be recalibrated. Forecast methodologies get adjusted when pipeline entry criteria should be raised. The team spends resources fixing symptoms while the root cause continues producing them.
Pipeline Inflation as a Decision-Making Problem
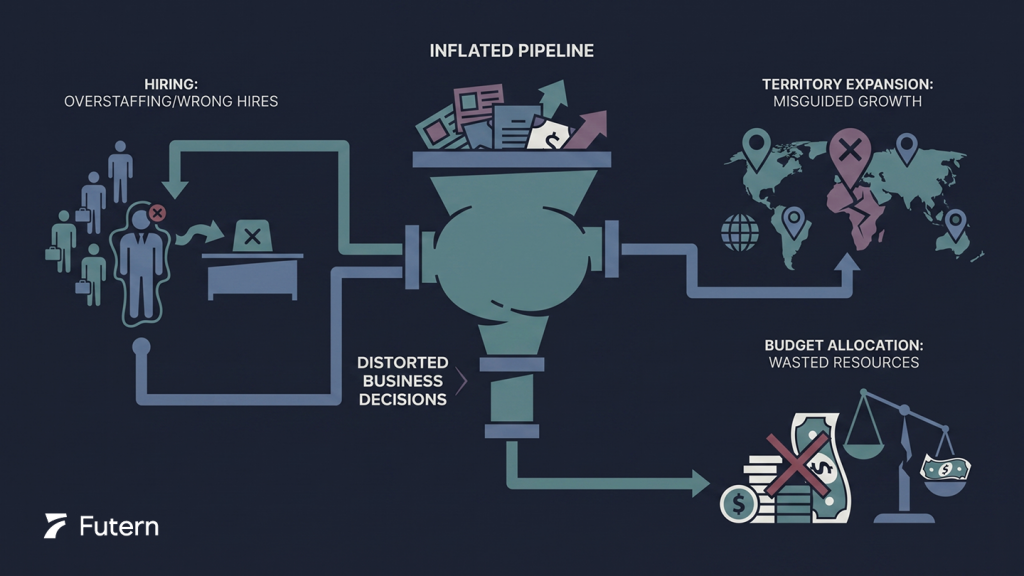
The distortion created by low-quality leads is most consequential when it enters the decision-making layer of the sales organization. Pipeline numbers do not just measure performance; they drive resource allocation.
Hiring decisions depend on pipeline. When a VP of Sales sees pipeline growing at 20 percent quarter over quarter, the natural conclusion is that the team needs more capacity to work that pipeline. Additional SDRs get hired, AE headcount expands, and support functions scale accordingly. If the pipeline growth was driven by volume rather than quality, the new hires are entering an environment where the lead-to-close ratio is deteriorating. The organization has added cost without adding proportional revenue capacity.
Territory and market decisions are similarly affected. Pipeline distribution across segments and geographies informs where the company invests next. If a particular vertical shows strong pipeline growth because lead sourcing happened to produce a high volume of contacts from that vertical, the company may double down on a market that appears promising but where close rates are actually below average. The pipeline signal said one thing; the revenue signal, which arrives quarters later, says another.
Marketing budget allocation completes the chain. When marketing is measured on pipeline contribution, the incentive is to optimize for pipeline creation volume. Channels and campaigns that produce high lead counts receive more budget, while channels that produce fewer but better-qualified leads may get deprioritized. The marketing team is responding rationally to its metrics, but the metrics are rewarding quantity over quality, and the downstream cost shows up as sales inefficiency rather than marketing misallocation.
The unifying problem is that pipeline is treated as a reliable leading indicator of revenue when its reliability depends entirely on the quality of what enters it. Inflated pipeline does not just produce inaccurate forecasts. It produces systematically wrong decisions across hiring, territory design, and budget allocation, each of which has costs that take quarters to correct.
The Costs Nobody Measures
Beyond the misattributed and decision-distorting costs, there is a category of damage that has no corresponding line item in any dashboard.
How Pipeline Data Gradually Corrupts the ICP
ICP drift is the most structurally dangerous hidden cost. Most teams update theirideal customer profile periodically, using pipeline data and closed-won analysis. When the pipeline contains a significant proportion of low-quality leads, their characteristics blend into the aggregate data that informs ICP adjustments. But the more insidious path is through marginal wins. Sales teams under quota pressure will push deals with prospects whose fit is borderline but whose budget is available. These marginal-fit customers close, enter the closed-won dataset, and their attributes begin influencing the ICP definition. Over two or three quarters, the profile gradually shifts to incorporate characteristics of customers who were never a strong match for the product. The result is a targeting profile that has been quietly diluted from two directions: bad leads contaminating pipeline-level analysis, and marginal wins contaminating closed-won analysis. This drift is difficult to detect because it happens incrementally, and by the time conversion rates decline noticeably, the ICP has already moved far enough from its original definition that correcting it requires a full re-analysis rather than a minor adjustment.
Good Deals Receiving Less Attention Than They Deserve
Opportunity displacement operates through bandwidth constraints. Every account executive has a finite amount of attention. When 30 or 40 percent of an AE's pipeline consists of opportunities that will ultimately go nowhere, the deals that might actually close receive proportionally less preparation, less creative problem-solving, and fewer follow-up touches. This is not a matter of time management or prioritization skill. It is a structural allocation problem: the AE's capacity is being consumed by opportunities that should never have reached them, and the cost shows up as underperformance on the deals that mattered.
Team Behavior That Adapts to Bad Inputs
Team behavior change is the subtlest and potentially most expensive hidden cost. SDRs who repeatedly experience the pattern of investing effort in leads that turn out to be unqualified begin adapting their behavior. Some become more conservative in their outreach, applying informal filters that reduce both bad-fit and good-fit prospect engagement. Others lose confidence in the lead sources and scoring systems they depend on, applying their own judgment in ways that are well-intentioned but inconsistent. Account executives who receive a steady stream of poorly qualified leads from the SDR team begin discounting what they receive, investing less in early-stage opportunities and waiting longer before engaging seriously. The trust relationship between marketing, SDRs, and AEs erodes, and rebuilding it requires more than simply improving lead quality. The behavioral patterns persist even after the input quality improves.
None of these costs has a metric attached to it in most sales organizations. ICP drift shows up as a slow conversion decline with no single identifiable cause. Displacement shows up as missed quota on deals that seemed winnable. Behavior change shows up as reduced activity and longer response times, often interpreted as a motivation or management issue rather than a rational adaptation to bad inputs.
Why These Costs Compound Rather Than Stay Flat
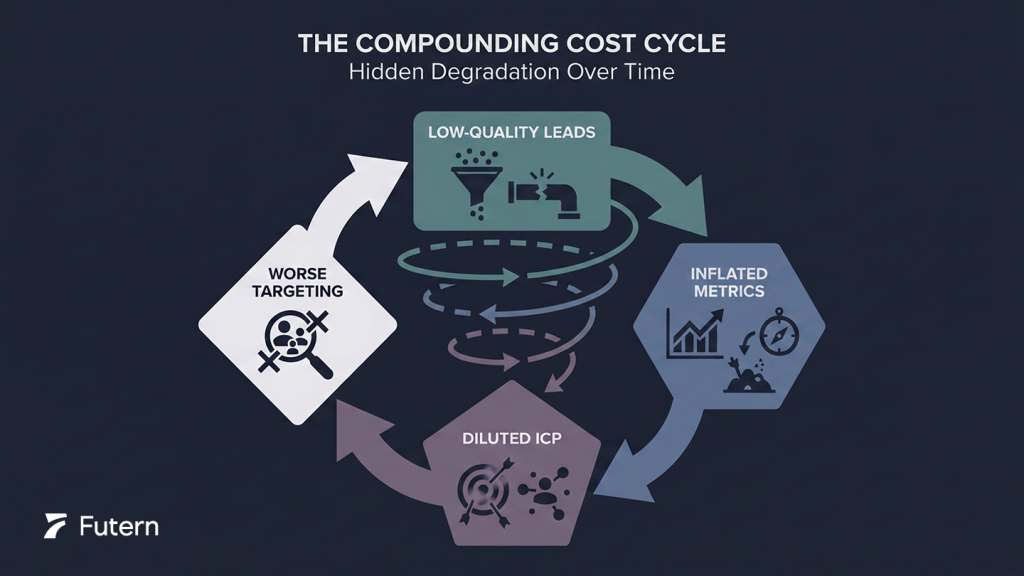
The visible costs of low-quality leads are roughly linear. Each bad lead wastes a predictable amount of time and resources, and the total cost scales proportionally with volume. The hidden costs behave differently. They compound.
The mechanism is a degradation cycle. Low-quality leads enter the pipeline and begin inflating pipeline metrics. Inflated metrics lead to resource decisions that add capacity to work a pipeline whose quality is declining. More capacity working worse leads produces more data that further dilutes the ICP. A diluted ICP generates targeting criteria that produce even more low-quality leads. Each quarter, the inputs to the system are slightly worse than the quarter before, and the outputs confirm the new baseline rather than challenging it.
This cycle is difficult to interrupt for two reasons. First, the lag between cause and effect is long enough that the connection is not obvious. The ICP adjustments made in Q1 based on Q4 pipeline data do not produce their full downstream effect until Q2 or Q3. By then, the team has made two more rounds of adjustments based on data that was already degraded. Second, the cycle operates within the normal range of business variability. A 2 or 3 percent decline in conversion rate per quarter does not trigger alarm. It gets absorbed into quarterly business reviews as noise. Over four or five quarters, that compounding decline represents a fundamental shift in pipeline economics, but at no single point did it look like a crisis.
The compounding nature of these costs also explains why the most common response to lead quality problems, increasing volume, makes the problem worse rather than better. Generating more leads from the same targeting logic produces more of the same quality distribution. The visible metrics improve temporarily because pipeline grows, but the hidden costs accelerate because the pipeline is absorbing a larger absolute number of low-quality leads, all of which contribute to forecast distortion, ICP drift, and team behavior change.
The compounding also crosses functional boundaries. When sales misses forecast because of pipeline quality issues that neither sales nor marketing has identified as such, the organizational response often involves tightening sales process controls, adding qualification stages, or restructuring handoff criteria between marketing and sales. These measures add friction to the process for all leads, including the good ones. The genuinely qualified prospect now faces more gates, longer response times, and more skeptical initial engagement because the system has been reconfigured to compensate for a quality problem that it still has not actually solved. The organization has added cost and complexity without addressing the upstream issue.
Breaking the cycle requires intervening at the input layer rather than compensating at the output layer. It means examining how prospects are sourced, how data quality is maintained, how qualification criteria are defined, and how signals beyond firmographic fit are incorporated into targeting decisions. These are the questions the remaining articles in this series are designed to address, starting with how modern prospecting and data enrichment change the quality equation at the top of the funnel.
Low-quality leads are not a nuisance cost. They are a structural problem whose full expense is distributed across forecasting, decision-making, team behavior, and compounding cycles that most organizations never trace back to their origin. Recognizing the full cost structure is the first step toward building a lead generation process that optimizes for pipeline quality rather than pipeline volume.
AI Sales Agents: Complete Buyer's Guide
Global Outbound Sales in 2026: What Actually Scales and What Doesn't