Measuring AI Sales Agent Performance: Metrics That Actually Matter
by Stella L
A layered metrics framework for measuring AI sales agent and AI SDR performance effectively.
Your AI sales agent has been running for 90 days. The system is generating meetings, the team has adapted to their evolved roles, and leadership wants to know: is this working?
The answer depends entirely on what you measure and how you interpret it.
Most teams default to one of two approaches, both of which produce misleading conclusions. Some evaluate AI performance using the same activity metrics they used for human SDRs: emails sent, calls made, tasks completed. These metrics measure effort, and AI does not operate on effort. Others jump straight to revenue attribution, which is meaningful but incomplete because AI outbound is the starting point of a pipeline that involves multiple human touchpoints before a deal closes.
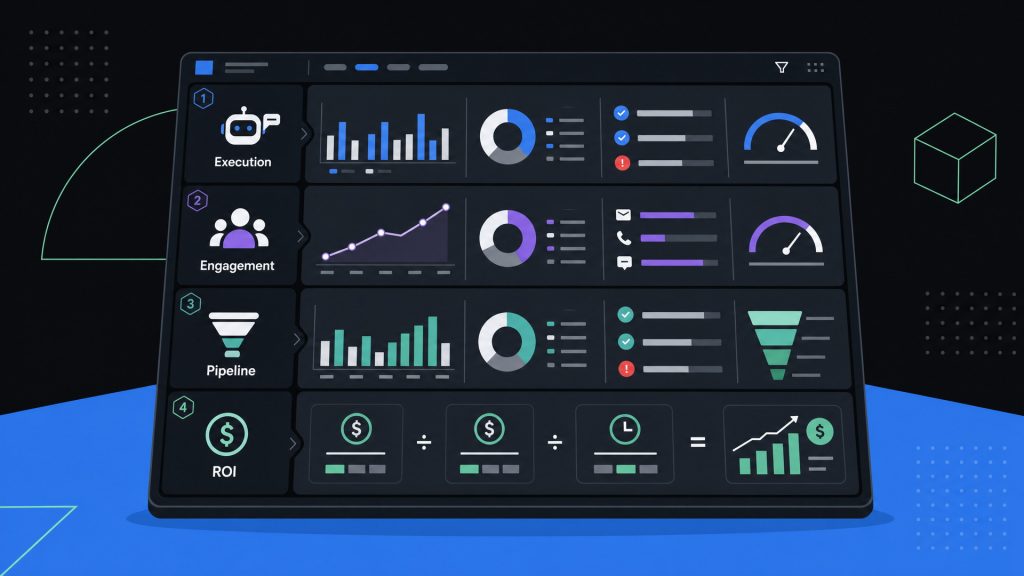
Effective AI sales agent measurement requires a layered approach. Execution metrics confirm the system is running correctly. Engagement metrics evaluate output quality. Pipeline metrics quantify business impact. Efficiency metrics validate the investment. Each layer answers a different question, and each layer matters to a different stakeholder.
This article provides a four-layer measurement framework you can apply directly to your AI SDR implementation.
Why Traditional Sales Metrics Fall Short
Traditional SDR performance measurement is built around human activity. Emails sent per day, calls made per hour, and meetings booked per rep are proxies for effort and discipline. They work for human teams because they correlate with output: an SDR who makes more calls generally books more meetings.
AI sales agents break this correlation. The system can send thousands of personalized messages per day with consistent quality. Measuring it on volume is meaningless because volume is not the constraint. Quality, targeting precision, and conversion efficiency are the variables that determine AI performance, and none of these are captured by traditional activity dashboards.
At the same time, measuring only at the revenue level creates a different problem. Revenue is influenced by deal size, sales cycle length, AE performance, market conditions, and competitive dynamics. Attributing revenue outcomes directly to the AI agent ignores every variable between the first outreach and the closed deal. A team might conclude the AI is underperforming when the real issue is AE capacity or pricing strategy.
The framework below addresses both problems by creating four distinct measurement layers, each with its own purpose and audience.
Layer 1: Execution Metrics
Execution metrics answer one question: is the system running correctly?
These are operational health indicators. They confirm that the AI agent is active, reaching prospects, and operating within expected parameters. They do not measure performance quality, but without healthy execution metrics, nothing else matters.
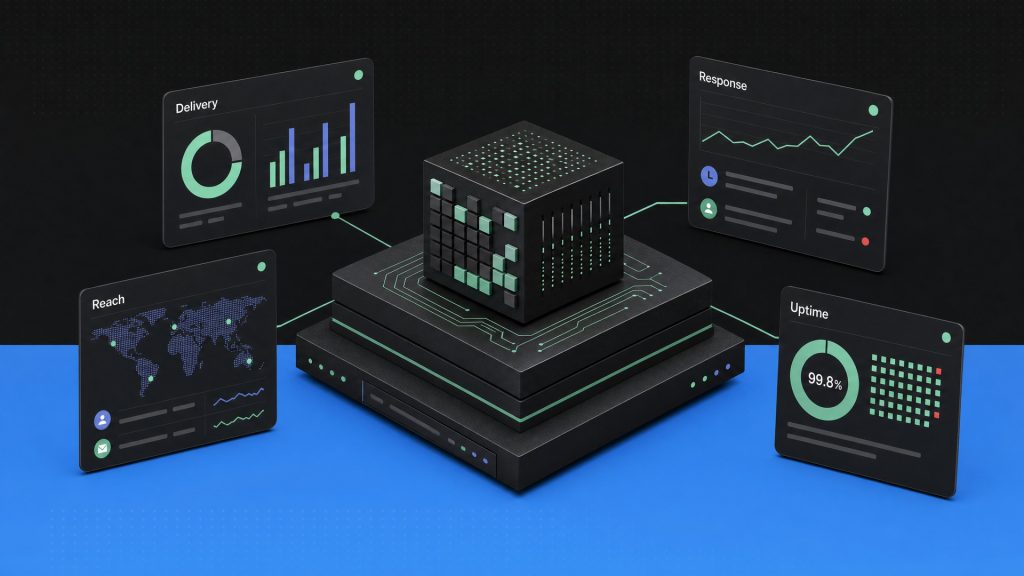
Outreach volume and delivery rates.
How many messages is the system sending, and what percentage are successfully delivered? Email delivery rates below 90 percent suggest deliverability issues that need technical attention. LinkedIn connection and message rates should be tracked against platform-specific limits. These numbers should be stable and predictable once the system is configured correctly.
Prospect reach rate.
Of the prospects in your target list, what percentage has the system actually contacted? A low reach rate might indicate data quality issues in your prospect list, overly narrow targeting parameters, or channel-specific delivery problems. This metric helps distinguish between a targeting problem and a messaging problem.
Response time.
When prospects reply, how quickly does the system respond? For AI SDR platforms, this should be near-instantaneous for automated responses and within defined SLA windows for responses that require human escalation. Slow response times on escalated conversations indicate a workflow gap between the AI system and your human team.
System uptime and consistency.
Is the system operating continuously without gaps? Unexpected pauses in outreach, inconsistent send volumes, or irregular scheduling patterns can indicate configuration issues that affect overall performance.
How to use Layer 1 metrics: Review weekly. These are health checks, not success measures. If execution metrics are stable and within expected ranges, move your attention to Layer 2. If they show anomalies, investigate before drawing conclusions from higher-level metrics. A drop in engagement rates means something very different if delivery rates also dropped versus if delivery remained stable.
Layer 2: Engagement Quality Metrics
Engagement metrics answer the next question: is the system's output generating meaningful prospect interaction?
This layer evaluates whether the AI agent's outreach is resonating with your target audience. These metrics are the earliest indicators of whether your targeting, messaging, and personalization are working.
Open rates.
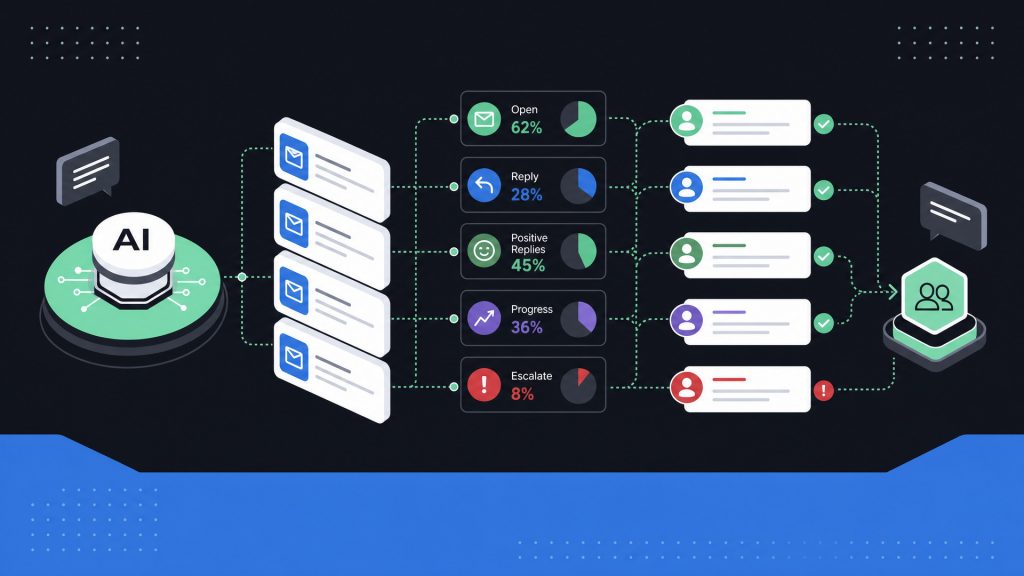
What percentage of email recipients are opening messages? Open rates are an imperfect metric due to tracking limitations, but trends over time are valuable. Improving open rates typically indicate that subject line optimization is working. Declining open rates may signal audience fatigue, deliverability degradation, or targeting drift into less relevant segments.
Reply rates.
What percentage of contacted prospects are responding? Reply rates are a stronger quality signal than open rates because they require active engagement. Track overall reply rates and positive reply rates separately. A high reply rate with a low positive reply percentage suggests the messaging is attention-getting but not relevant, which is a different problem than low reply rates overall.
Conversation progression rates.
Of the prospects who respond positively, how many progress through a multi-turn conversation to a meaningful outcome such as a meeting or a qualified handoff? This metric evaluates the AI's conversation handling capability. A high positive reply rate but low progression rate indicates the system is generating initial interest but losing prospects during follow-up exchanges.
Escalation patterns.
How frequently does the AI escalate conversations to human team members, and what triggers those escalations? A very high escalation rate suggests the system's conversation handling needs refinement. A very low escalation rate in a complex selling environment might indicate the system is handling conversations it should be routing to humans. Track escalation reasons to identify specific conversation types where the AI needs improvement.
How to use Layer 2 metrics: Review weekly in the first 90 days, then bi-weekly once trends stabilize. The primary value of engagement metrics is in their trajectory. Improving trends confirm that optimization cycles are working. Declining trends require investigation into whether the issue is messaging, targeting, market conditions, or data quality. The rate of improvement itself is also meaningful. An AI sales agent that shows steady engagement gains over its first three to six months is demonstrating effective learning and adaptation. If engagement metrics plateau early without reaching competitive benchmarks, that signals a configuration or data quality issue worth investigating. Compare engagement metrics across segments, markets, and channels to identify where the system performs strongest and where adjustments are needed.
Layer 3: Pipeline Impact Metrics
Pipeline metrics answer the question leadership cares about most: is the AI agent contributing to real business results?
Meetings booked.
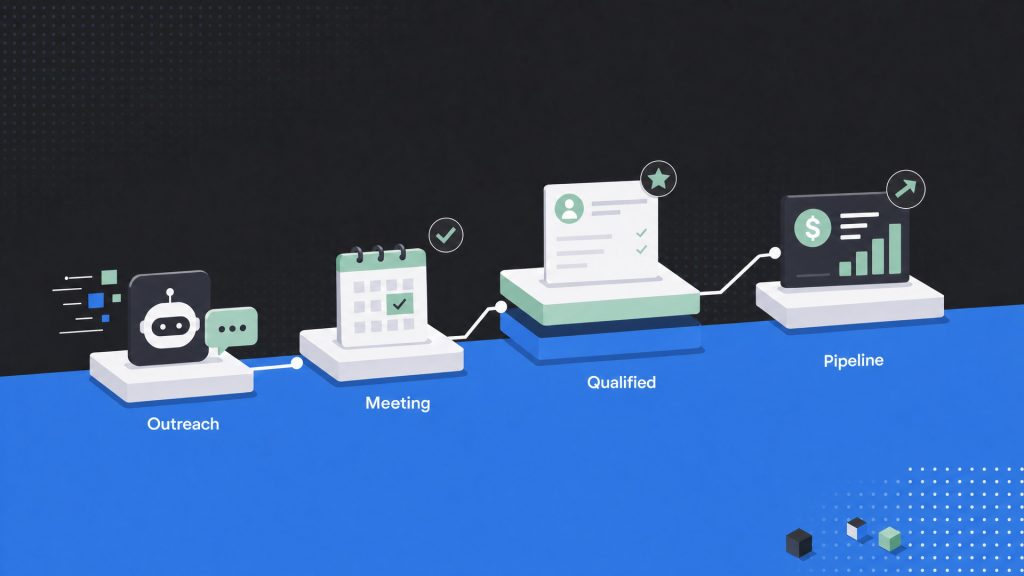
The most visible output metric. Track total meetings booked by the AI SDR system and compare against your pre-implementation baseline. Be specific about what counts as a "meeting" in your measurement: a calendar hold, a confirmed attendance, or a completed conversation. Inconsistent definitions make trend analysis unreliable.
Meeting qualification rate.
Of the meetings the AI books, what percentage are genuinely qualified based on your team's criteria? This is the quality check on meeting volume. An AI agent that books 50 meetings per month with a 40 percent qualification rate is delivering less real value than one that books 30 meetings with an 80 percent qualification rate. Track this metric through AE feedback after each meeting.
AI-sourced pipeline value.
What is the total pipeline value of opportunities that originated from AI outbound? This metric connects AI activity to revenue potential. Track it monthly and compare against pipeline sourced through other channels to understand the AI agent's relative contribution to your overall pipeline. For accurate tracking, tag opportunities where the AI agent made the first meaningful contact as "AI-sourced" in your pipeline reporting. This first-touch approach provides a clean baseline for measuring the AI system's contribution without getting tangled in complex multi-touch attribution models that are difficult to maintain and harder to defend in executive reviews.
Pipeline velocity.
How long does it take from first AI outreach to booked meeting, and from booked meeting to qualified opportunity? Compare these timelines against your human-sourced pipeline velocity. AI-sourced pipeline often moves faster through early stages because the system maintains consistent follow-up and optimal timing, but may show different patterns in later stages depending on prospect fit and engagement quality.
How to use Layer 3 metrics: Review monthly. Pipeline metrics require time to accumulate meaningful data. Month-over-month trends are more informative than any single month's numbers. Share these metrics with sales leadership as the primary performance indicators for the AI investment.
Layer 4: Efficiency and ROI Metrics
Efficiency metrics answer the final question: is the investment delivering strong returns?
Cost per meeting.
Divide total AI platform costs, including subscription, any per-contact or per-action fees, and internal management time, by the number of meetings booked. Compare this against your cost per meeting from human SDR teams. This comparison should use fully loaded costs on both sides: human SDR cost per meeting should include compensation, benefits, tools, management overhead, and ramp time, not just base salary divided by meetings.
Cost per qualified opportunity.
A more meaningful metric than cost per meeting because it accounts for meeting quality. Divide total AI costs by the number of qualified opportunities generated. This is the metric that connects most directly to revenue economics.
Time savings for the team.
Quantify how much time your team has recovered by offloading execution to the AI agent. SDRs who shifted from manual outreach to quality review and escalation handling are spending their time differently. AEs who receive AI-generated context are spending less time on pre-call research. Estimate these time savings and translate them into either capacity gains (more accounts covered) or productivity improvements (more selling time per rep).
Total ROI calculation.
Combine cost savings and revenue impact into a single ROI figure. The formula is straightforward: (closed-won revenue from AI-sourced pipeline plus cost savings from reduced manual effort minus total AI platform costs) divided by total AI platform costs. Use actual revenue from closed deals, not pipeline value. Pipeline converts to revenue at varying win rates, and using raw pipeline value in ROI calculations inflates the number in ways that undermine credibility with finance and executive teams. If deals sourced by the AI agent are still in progress, you can use expected revenue (pipeline value multiplied by your historical win rate) as a conservative interim estimate. Be conservative in your attributions. It is better to understate ROI with defensible numbers than to overstate it with aggressive assumptions that undermine credibility in quarterly reviews.
How to use Layer 4 metrics: Review quarterly. Efficiency metrics need sufficient data volume to be meaningful, and month-to-month fluctuations can create misleading impressions. Present these metrics to executive leadership alongside the methodology you used to calculate them. Transparency in calculation methodology builds confidence in the numbers.
Building Your Measurement Dashboard
The four layers serve different stakeholders at different cadences. Organizing your reporting accordingly prevents information overload and ensures each audience sees the metrics most relevant to their decisions.
Operations and implementation owners focus on Layer 1 and Layer 2. They need weekly visibility into system health and engagement trends to make tactical adjustments. Their dashboard should surface anomalies quickly and track optimization progress over time.
Sales leadership focuses on Layer 3. Monthly pipeline impact reports that show meetings booked, qualification rates, and pipeline value give them the data they need to evaluate the AI agent's contribution and make resourcing decisions. Include segment-level and market-level breakdowns so leadership can see where the system is producing the strongest results.
Executive team focuses on Layer 4. Quarterly efficiency and ROI reporting connects the AI investment to business outcomes in the language executives care about: cost reduction, revenue contribution, and return on investment. Keep this reporting concise and grounded in conservative, defensible numbers.
A practical approach is to build one unified dashboard that contains all four layers, with views filtered by audience. The implementation owner sees everything. Sales leadership sees Layer 2 through 4. Executives see Layer 3 and 4. This ensures consistency in the underlying data while tailoring the presentation to each audience's needs.
From Measurement to Action
Metrics are only valuable if they inform decisions. Each layer of this framework should connect to a specific action when the data shows something unexpected.
Declining Layer 1 metrics trigger a technical investigation. Declining Layer 2 metrics trigger a messaging and targeting review. Declining Layer 3 metrics require a deeper analysis of whether the issue originates in outreach quality, meeting qualification criteria, or post-meeting conversion. Declining Layer 4 metrics prompt a strategic conversation about platform value and whether changes in configuration, scope, or vendor are warranted.
The measurement framework you build during the first few months of your AI sales agent implementation becomes the management tool you use for the life of the platform. Investing time in getting it right early pays returns through every subsequent quarter of operation.
This article is part of our AI Sales Agents: Complete Buyer's Guide, which covers the full evaluation and selection process from capabilities analysis through implementation planning.
Read More: Global Outbound Sales in 2026: What Actually Scales and What Doesn't
Explore more AI & Automation insights here.